Shanker Blog: Effects of COVID-19 on Students’ Academic Achievement, Behavior, and Social-Emotional Well-Being
Our guest author today is Dr. Alvin Larson, Director of Research and Evaluation at Meriden Public Schools, a mid-sized urban Connecticut school district that serves about 8,700 students in Meriden, CT. Dr. Larson holds a B.A. in Sociology, M. Ed., and M.S. in Educational Research, and a Ph.D. in Educational Psychology. The work and social-emotional instruments utilized below were made possible with the support from Meriden’s community, leadership and educational professionals.
Over the past year or two there have been many reports, and predictions, in the media of students losing “years” of academic and social development as a direct or indirect result of the COVID-19 pandemic. Many of these reports are based on first-hand views of school professionals such as understaffed school psychologists, counselors, and teachers who have witnessed large increases in concerning student behaviors and a decrease in academic skills.
I am an Educational Psychologist embedded in an urban school district, where 77 percent of students are eligible for free/reduced price meals, 75 percent are minority, 20 percent are classify for special education, and 17 percent are English Language Learners. These students are exposed to many of the typical urban issues which add to our education challenges. Thanks to the support of the Meriden community, leadership, and educational professionals, I have been able to reliably measure student academic, behavioral and social-emotional development over the past ten years. In this essay, to estimate the effects of the COVID-19 pandemic on students’ well-being; I am reporting cross-sectional data from three academic years 2019-20 (pre-COVID), as well as 2020-21 and 2021-22 (during/post COVID). While I will share aggregate changes in students’ academic measures as well as data on students’ suspension and teacher level data on perceptions of students’ behaviors across the pre-post COVID years, my primary focus is on students’ social-emotional well-being and how it has changed over the past few years.
As the next few paragraphs will detail, elementary school students have had a much more difficult time than secondary school students in adjusting to the effects of the COVID pandemic. The table below summarizes students’ well-being changes over the COVID-19 years.
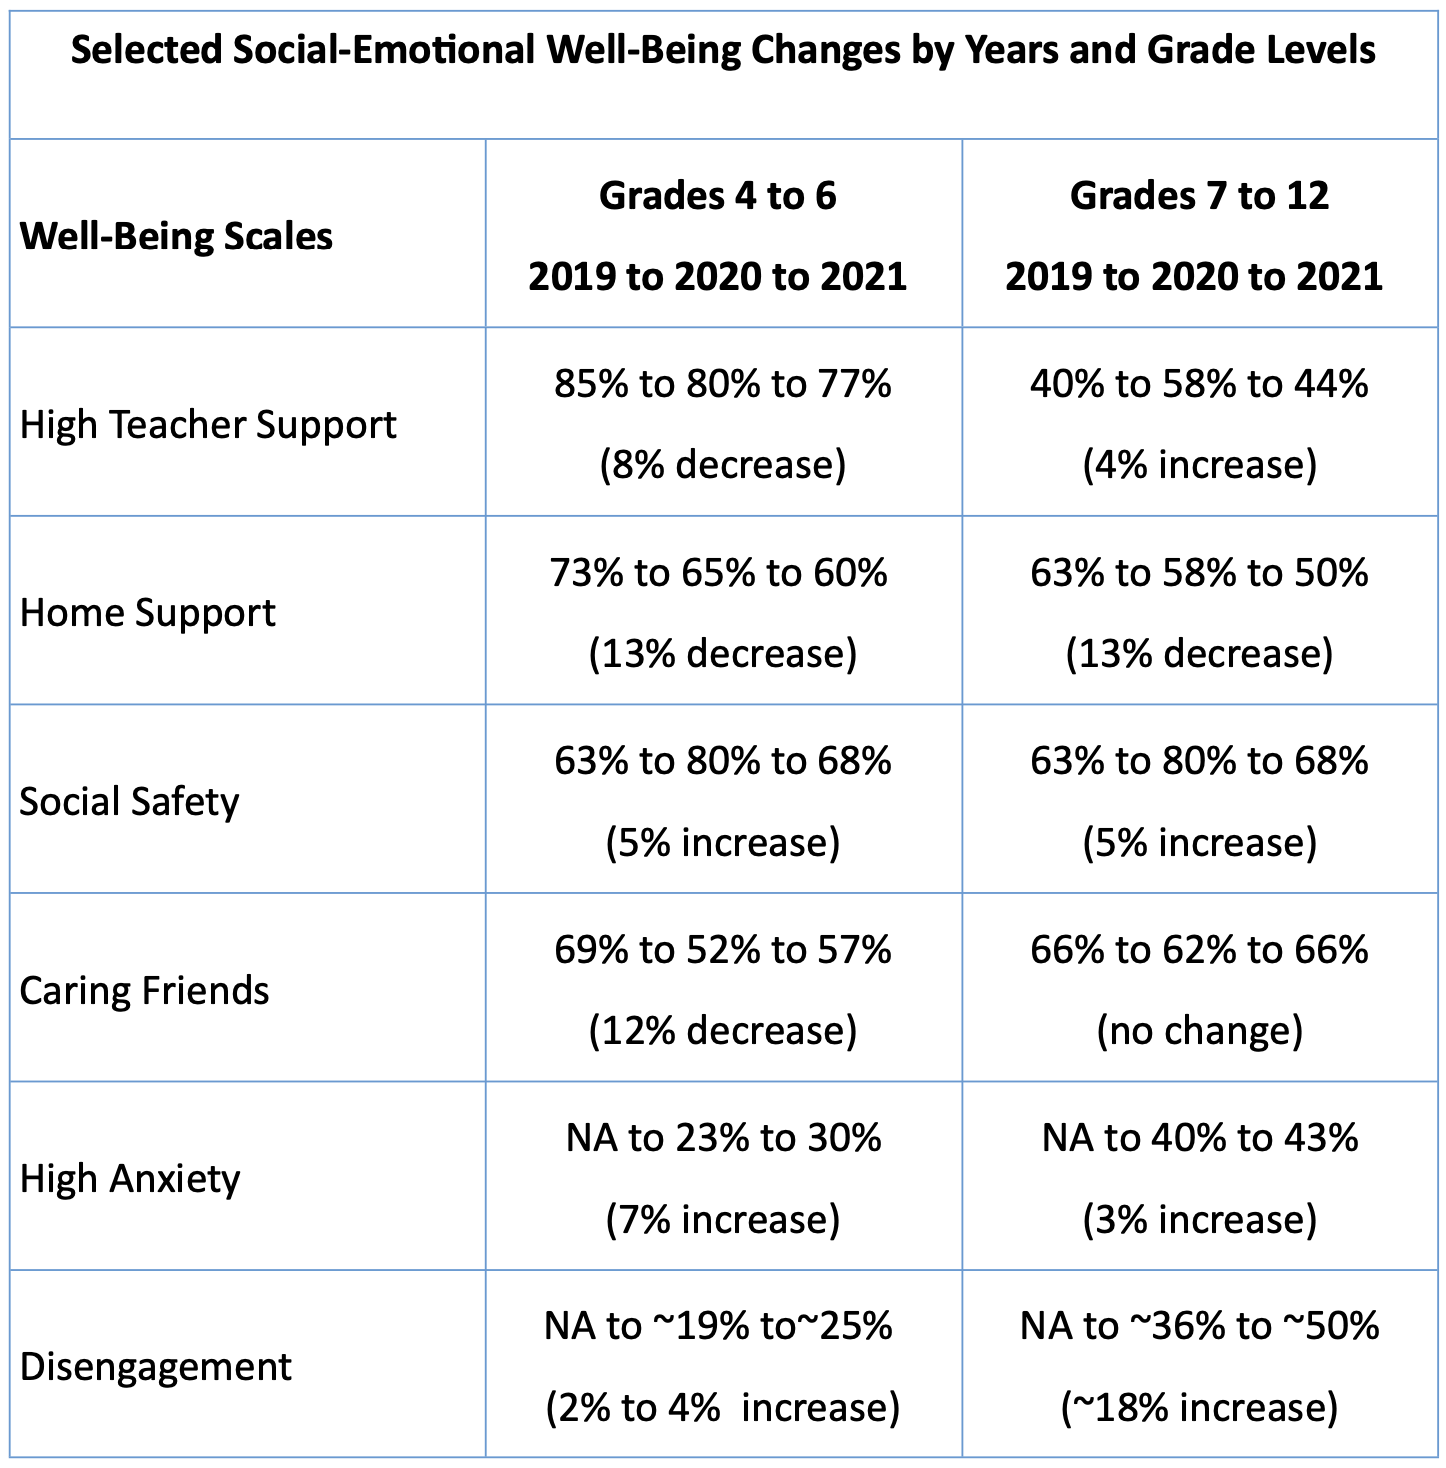
The rest of this essay discusses and contextualizes these results as well behavioral and academic changes.
Academic
Meriden’s academic measures presented here are I-Ready (Curriculum Associates) and SAT (College Board); Smarter Balanced assessment results are not yet available at the time of this writing. However, preliminary Smarter Balanced results do mirror the I-Ready results.
The I-Ready reading and math assessment results compare the winter of 2020 (two months prior to the nationwide COVID-19 related school closures in March of 2020) with the winter of 2022. For both reading and math at the elementary level (Kindergarten to Grade 5), the average scale scores did decrease: -40.1 scale score points and -2.0 scale score points for reading and math respectively. The largest decreases were in Grades 2, 3, and 5,. Fourth graders scores only decreased 4.4 scale score points in reading and 3.0 scale score points in math. Kindergarteners and first graders showed average scale score increases. The cross-sectional decrease of 40.1 scale score points in elementary reading is sizable. By contrast, the middle school grades (6th through 8th) recorded small cross-sectional scale score point increases of +3.1 and +1.2 for reading and math respectively.
The second set of measures I looked at were the SAT Evidence Based Reading and Writing (EBRW) and Math; my analyses compare scores from the spring of 2019 with the spring of 2022. For EBRW and Math there were small increases in both the average scale score (+1.3 points for EBRW and +0.4 points for Math) and the percent of students meeting the Benchmarks (+0.8 percent for EBRW and +0.5 percent for Math).
The only real academic decrease is across the elementary grades in Reading which recorded an average decrease of 40 scale score points, which is a one-year decrease from their 2018-2019 grade level cohort. The change in elementary Math -2 scale score points was not a meaningful difference as were the middle school change increases of +3.1 and +1.2
Behavioral
Next, I share results on the average number of suspensions from the 2017-2018 and 2018-2019 pre-COVID years and compare them with data from the 2021-2022 school year. During the two school years prior to COVID there were, on average, 904 suspensions in the district. During the 2021-2022 school year there was a 42.6 percent increase in the number of suspensions. During the pre-COVID years, 5.6 percent of the student population was suspended; this increased to 8.5 percent during 2021-2022.
Each spring, Meriden teachers are surveyed on a variety of topics; one of these topics is student behavior. The student behavior scale is a 1 to 5 scale. The spring 2019 Student Behavior average scale score results were compared to the spring 2022 Student Behavior scale. Teachers’ perceptions of students’ behavior varied by school level. Despite several newspaper reports of fights at Meriden’s high schools in the fall of 2021, and a large increase in suspensions, high school teachers rated student behavior 7.7 percent more socially acceptable in 2022 than they did in 2019. However, both middle and elementary school teachers rated student behavior lower in 2021-22 by 6.7 percent and 13.9 percent respectively. This perceived and documented increase in student misbehaviors, especially at the elementary level, reinforces media reports that students may be “losing years” of social skills because of the COVID-19 pandemic.
Social-Emotional
Meriden has developed two unique, valid and reliable student surveys: Meriden’s School Climate Survey for Students (Gage, Larson, Sugai, and Chafouleas 2016) which measures school-related social development, and our Getting to Know You Survey which measures motivations and mindsets. Both of these surveys provide actionable data at the student level.
Because of temporal constraints, I will report only on our school climate measures across the COVID years. Our school “climate” survey is really an on-line, social-emotional screener administered in the fall of each school year to students in grades 4 to 12. Low school climate scores are associated with lower academic achievement, and problem behaviors. There are three scales relating to adult-student relationships (Teacher Support, Parent Values School, and Home Support). There are three scales relating to student-to-student relationships (Social Safety, Caring Friends, and Non-Aggression). There are also three scales relating to internal student perceptions (Anxiety-Assurance, Psychological Engagement to School, and the traditional Sense of Belonging). The COVID-19 Pandemic affected all but one of these scales. All of these climate measures are on a 1 to 5 scale; the higher a student scores on any scale the more pro-social the student is on that measure. The rest of this blog post describes changes in these measures during the COVID-19 Pandemic years.
Teacher Support
As students progress through middle school their relationships with adults tend to be less important and peer relationships generally become more important. Similar to other scales (Skinner, et al., 2008), the Teacher Support scale decreases across middle and high school. The Teacher Support items include: teachers help and respect me, make me want to learn, tell me when I do well, listen to me, and is someone I can trust. About 85 percent of students exiting elementary school perceive “High” levels of Teacher Support. The percent of students who record a “High” Teacher Support decreases to about 70 percent in grade 6 and to 40 percent in grade 8. There were also differences associated with the mode of instruction (in-school versus remote) during the COVID-19 Pandemic.
At the elementary level, grades 4 and 5, there were small decreases from 85 percent in fall 2019 to 80 percent in fall 2020 to 77 percent in fall 2021 in their perception of “High” Teacher Support, overall an 8 percent decrease across the COVID years. However, for grades 7 to 12, students’ perception of “High” Teacher Support increased from 40 percent in 2019, to 58 percent in 2020, then down to 44 percent in 2021. Overall, secondary students’ perceptions of Teacher Support increased over the COVID years. This may be partly explained by the much smaller class sizes, the diligence of remote learning teachers having extra “office hour” supports, and the district-wide increased technical support/hot spots. Students who report a significant annual decrease in Teacher Support should be seen by counselors. Such a decrease may indicate the student feels ignored and less respected, which may lead to disengagement from his/her schooling.
Home Support
The COVID Pandemic disrupted the economy, employment, and the home life for many students. The items on Home Support relate to: having a quiet place and time to do schoolwork, having a parent who listens and will help me.
The percent of students who perceived “High” Home Support before COVID, ranged between 65-70 percent, during COVID this percentage decreased to 55-65 percent and continued to decrease in the fall of 2021 to 45-60 percent across grade levels. On average, this is a 13 percent decrease in “High” Home Support which is continuing and may be an extended effect of COVID and its disruptive effect on employment and home routines. If a student is low on this scale, his/her ability to do homework is diminished which may lead to devaluing schoolwork. Teachers should at least be aware of this student’s barrier when they assign homework.
Parent Values School
The student’s perception that their parent/guardian values school is an important motivator for students to succeed in school. The average student perception that parents value their schooling has consistently remained very high. The items on this scale relate to a parent/guardian caring about the student’s homework, expects the student to follow school rules (including the remote classroom rules), and wants the student to do their best. The percent of students who believe their parent/guardian highly valued their schooling remained constant, before, during and after COVID at around 91-93 percent. A significant decrease in a student’s perception that his/her parent/guardian is not valuing the student’s schooling is not common, and may not be accurate, but even the perception of a significant adult not valuing their education may hamper the student’s motivation and lead to disengagement from schooling.
These Three Scales
The three adult-student relationships scales (Teacher Support, Parent Values School, and Home Support) are important to monitor. A significant annual decrease in any one of the ten climate measures automatically generates a Factor-Score Drop Warning trigger email to the school psychologist and other counselors, so they can respond to the student’s issue in real time – often within minutes. However, a significant decrease in all three of the adult-student relationship scales is rare but especially troubling. About five years ago, a 7th grader (student Z) had multiple and substantial annual scale score decreases: Teacher Support (4.09 to 1.1), Parent Values school (4.75 to 1.0), and Home Support (4.0 to 1.0). Student Z perceived all of his/her significant adults, both at home and school, change from highly caring and supportive adults to the very lowest levels of caring and support. Over time, these feelings of rejection became more aggravating and two years later, student Z threatened to “shoot up” the school. Following this disturbing incident, the Factor Score Drop Warning system was developed. Had the automated Factor Score Drop Warning been in existence then, student Z would have been identified, and counseling would have been provided two years earlier. This type of student profile is now automatically identified in time for proactive interventions from counselors. Counselors in Meriden Public Schools have many trigger emails generated from our school climate platform to address each fall-winter. While sudden increases in caseloads are likely for counselors when the climate survey is administered, their diligent work can address can address many unreported (but real) “minor” student problems before they become exacerbated.
Social Safety
Student social-emotional safety was the primary reason for the development of this online, “climate” survey in 2010-2011. All students are made aware that this is a confidential survey and what that means: we will not share their answers unless a student is in danger. The items on the Social Safety scale ask about: hurt feelings, if another student hits, or threatens, or spreads mean rumors about them. Depending on how the student responds to the questions, a trigger email is automatically sent by the climate survey software to the school psychologist, social worker, counselors, and administrators that this specific student is in social-emotional stress. The response from professional staff is often within minutes.
The year of the COVID did have an effect upon students’ perception of “High” Social Safety (meaning they feel very safe). Across grades 4 to 12, the percent of students who report “high” Social Safety was 63 percent in 2019, up to 80 percent during COVID, then down to 68 percent when all students returned to in-person instruction. Smaller class sizes, less student-to-student contacts and remote instruction contributed to the ironic increase of Social Safety during COVID. However, less student-to-student contact could lead to increased social isolation for some students, which is measured by the Caring Friends scale.
Caring Friends
Developing strong social skills is an important school outcome that is usually not measured. The Caring Friends items ask students if they have a friend their own age that really cares about them, talks to them about his/her problems and is someone they can really trust. The percent of students who report having “High” Caring Friends did vary across the three COVID years.
There were only minor changes in grades 7 to 12 but students in grades 4 to 6 experienced greater changes. For grades 7 to 12, the percent of students with “High” Caring Friends was 66 percent in 2019, 62 percent in 2020, and back to 66 percent in the fall of 2021. Elementary to grade 6 students experienced a more severe fluctuation and these grades have not yet recovered to their pre-COVID levels. For grades 4 to 6, the percent of students with “High” Caring Friends was 69 percent in 2019, decreasing to 52 percent in 2020 during COVID, and up slightly to 57 percent in the fall of 2021. Overall, a 12 percent decrease in Caring Friends probably increased social isolation at the elementary level. Social isolation may hamper school engagement, and academic achievement. Similar to Home Support, COVID seems to have a more lasting effect on Caring Friends in the elementary grades.
Non-Aggression
Upon the return to in-person instruction for all students in the Fall of 2021, the percentage of the student population who had any suspension jumped to 8.5 percent, a 52 percent increase. For staff responsible for managing student aggression and rule breaking, this is a very large increase. Still, the vast majority of students generally abide by school rules and do not hit or threaten each other. In school, they are non-aggressive. The items of Non-Aggression scale relate to: spreading mean rumors, or hitting or pushing other students, and having been hit or threatened by other students. The percent of students that report as being “Highly” Non-Aggressive in school was 90 percent 2019, up to 94 percent during COVID (2020), and back down to 91 percent in 2021. Although the percentage of students with one of more suspensions increased from 5 to 8 percent, the vast majority of students (91 percent) self-reported as being highly Non-Aggressive.
Anxiety-Assurance
Students with high anxiety has been a national mental health concern for years, and there are predictions in the media that the COVID Pandemic will increase the percentage of students suffering from increased anxiety. During the 2017-2018 school year, high school upperclassmen were asked to write a letter to their younger peers in middle school about a personal problem they had when they were in middle school, and how they overcame their problem. I read hundreds of these personal problem letters; to my surprise, about 22 percent of these letters were about anxiety, which started in middle school. This finding motivated my work on developing our current Anxiety-Assurance scale which was first administered in the fall of 2020.
The Anxiety-Assurance scale is measured by items asking about the frequency students experiencing anxiety (being worried) and stress, both in school and out of school, as well as feeling sad. Students scoring low on the Anxiety-Assurance scale indicates a “high” level of anxiety. For grades 4-6, the percentage of students reporting “high” anxiety went from 23 percent in 2020 to 30 percent in 2021. However, for grades 7-12, “high” anxiety was about 40 percent in 2020, and 43 percent in the fall of 2021. The 7 percent increase in anxiety in the elementary level and only 3 percent in the secondary level is noteworthy, but it is concerning that over 40 percent (up to 48 percent in grades 11 and 12) of secondary students’ report “high” level of anxiety.
Students may worry about everything from separating from parents at drop-off to speaking up in class to feeling like their work has to be perfect. When kids are anxious in the classroom, they might have a hard time focusing and anxiety can also make kids aggressive. When children are feeling upset or threatened and don’t know how to handle their feelings, they might attack another child or a teacher, throw things, or push over a desk because they’re feeling out of control. Schools generally react to only the observed symptoms of anxiety, such as misbehavior or inattention. We are just beginning to try to address anxiety through universal SEL programs, which would be more effective if they also utilized a targeting component – such as a climate survey measuring SEL issues.
Similar to Home Support and Caring Friends, the related effects from COVID seems to have a continued influence on student anxiety. The increase in anxiety may be partly from increased academic pressure as grade level increases. Demanding schoolwork is stressful, but teachers are there to support all students. Also, the increased relational conflict with peers due to the return of in-person instruction, fewer caring friends, or a perceived decrease in Home Support may also increase anxiety. One coping mechanism of anxiety is the psychological disengagement from school.
Engagement
Psychological disengagement from school at the secondary level has long been reported in the literature. As much as one third of secondary students may have some degree of disengagement as evidenced in selecting less demanding courses, doing as little schoolwork as possible, lower in-class participation, and just drifting through school. The Engagement Scale has items relating to both positive and negative perceptions of schooling. Positive items are: I’m happy to be in this school; teachers help and listen to me; and classes are meaningful. Negative items relate to: giving up when schoolwork gets hard; spacing out in school; feeling school is stressful; and being sad in school. The negative items are “recoded” such that the higher the Engagement scale score across all of these items, the more engaged the student is with school activities. Table 1 graphs the level of disengagement by grade level and school year.

The effects of the COVID Pandemic seem to have little influence for grades 4 to 6, but for grades 7 to 12, along with decreased Teacher Support and increased anxiety, Table 1 shows a 13 percent to 18 percent increase in disengaged students. Disengagement leads to less effort and lower achievement in school.
Sense of Belonging
Sense of Belonging to school is a traditional measure across the U.S and internationally. The items relate to: being happy in school; teachers care, listen and can be trusted; other students are polite; having friends in school; and schoolwork is meaningful. Students with a “High” Sense of Belonging vary by both grade level and racial identity. Students in grades 4 to 6, who had some difficulty with Caring Friends during COVID, reported about a 10 percent decrease in “High” Sense of Belonging from 2019 to 2020 (72 percent to 62 percent), but then increased 10-12 percent back to 74 percent upon the return to in-person schooling in 2021. Students in grade 7 across years remained consistent: 51 percent to 52 percent to 50 percent for fall 2019, 2020, and 2021 respectively. About 46 percent of the students in grade 8 to 12 reported a “High” Sense of Belonging in the fall of 2019, which also remained consistent at 45 percent in 2020 and 43 percent in the fall of 2021.
Summary
This brief report reviews one school district’s cross-sectional changes across the COVID-19 years in academic achievement, student behavior, and student social-emotional dispositions. Meriden’s School Climate Survey is really a unique, annual screener designed to identify specific students in social-emotional stress, allowing professional staff to mediate in real-time. This survey is just a tool; the real work is done by school psychologists, social workers, counselors, teachers, and administrators; their timely actions prevent students’ emotional stress from exacerbating. This tool also identifies students’ social-emotional needs in the aggregate and may be utilized to evaluate school-wide SEL programs.
Elementary school students have had a much more difficult time than secondary school students in adjusting to the effects of the COVID Pandemic. Elementary school students generally had a one-year decrease in reading achievement and small decreases in math versus their 2019-2020 grade level cohorts. Elementary teachers report a 14 percent decrease in prosocial student behaviors; along these lines, suspensions of elementary grade students also increased over 40 percent. Elementary students’ perceptions of Teacher Support decreased 8 percent; Home Support decreased 13 percent; Caring Friends decreased 12 percent; and anxiety increased 7 percent during the pandemic, now up to 30 percent across grades 4 to 6.
Secondary Students maintained or slightly increased the average academic achievement of their 2019-2020 grade level cohorts. However, suspensions increased over 40 percent. Secondary students’ perceptions of Teacher Support increased 4 percent over the 2019-2020 cohort. While students’ reported anxiety level increased slightly (3 percent), it remains very high overall with more than 40 percent of students across grades 7 to 12 reporting high anxiety.
When COVID closed schools in mid-March 2020, Meriden was well situated to go remote. Nearly all grades were one-to-one for computer devices, so both students and teachers were computer literate enough to start using Google Classroom. Additional staff development was implemented and teachers were providing remote instruction and setting up “office hours” for extra help by late March. In addition, about 65 percent of students remained “in school” during the COVID-19 pandemic. As a result, there was little loss of instructional time.
We all hope that COVID is really over, but schools across the country had many learning experiences which will continue to improve education. We also hope that students, especially elementary students, will fully recover from this pandemic during the next school year.
This blog post has been shared by permission from the author.
Readers wishing to comment on the content are encouraged to do so via the link to the original post.
Find the original post here:
The views expressed by the blogger are not necessarily those of NEPC.